Early observations about the new Portfolio Trade Flag from FINRA® TRACE
Published
May 2023
- TRACE started disclosing Portfolio Trades via a flag on 5/15/2023. For the first week these were 5.2% of the notional transacted
- Most portfolio trades get reported between 15:00-15:05, 16:00-16:05 and 16:30-16:35
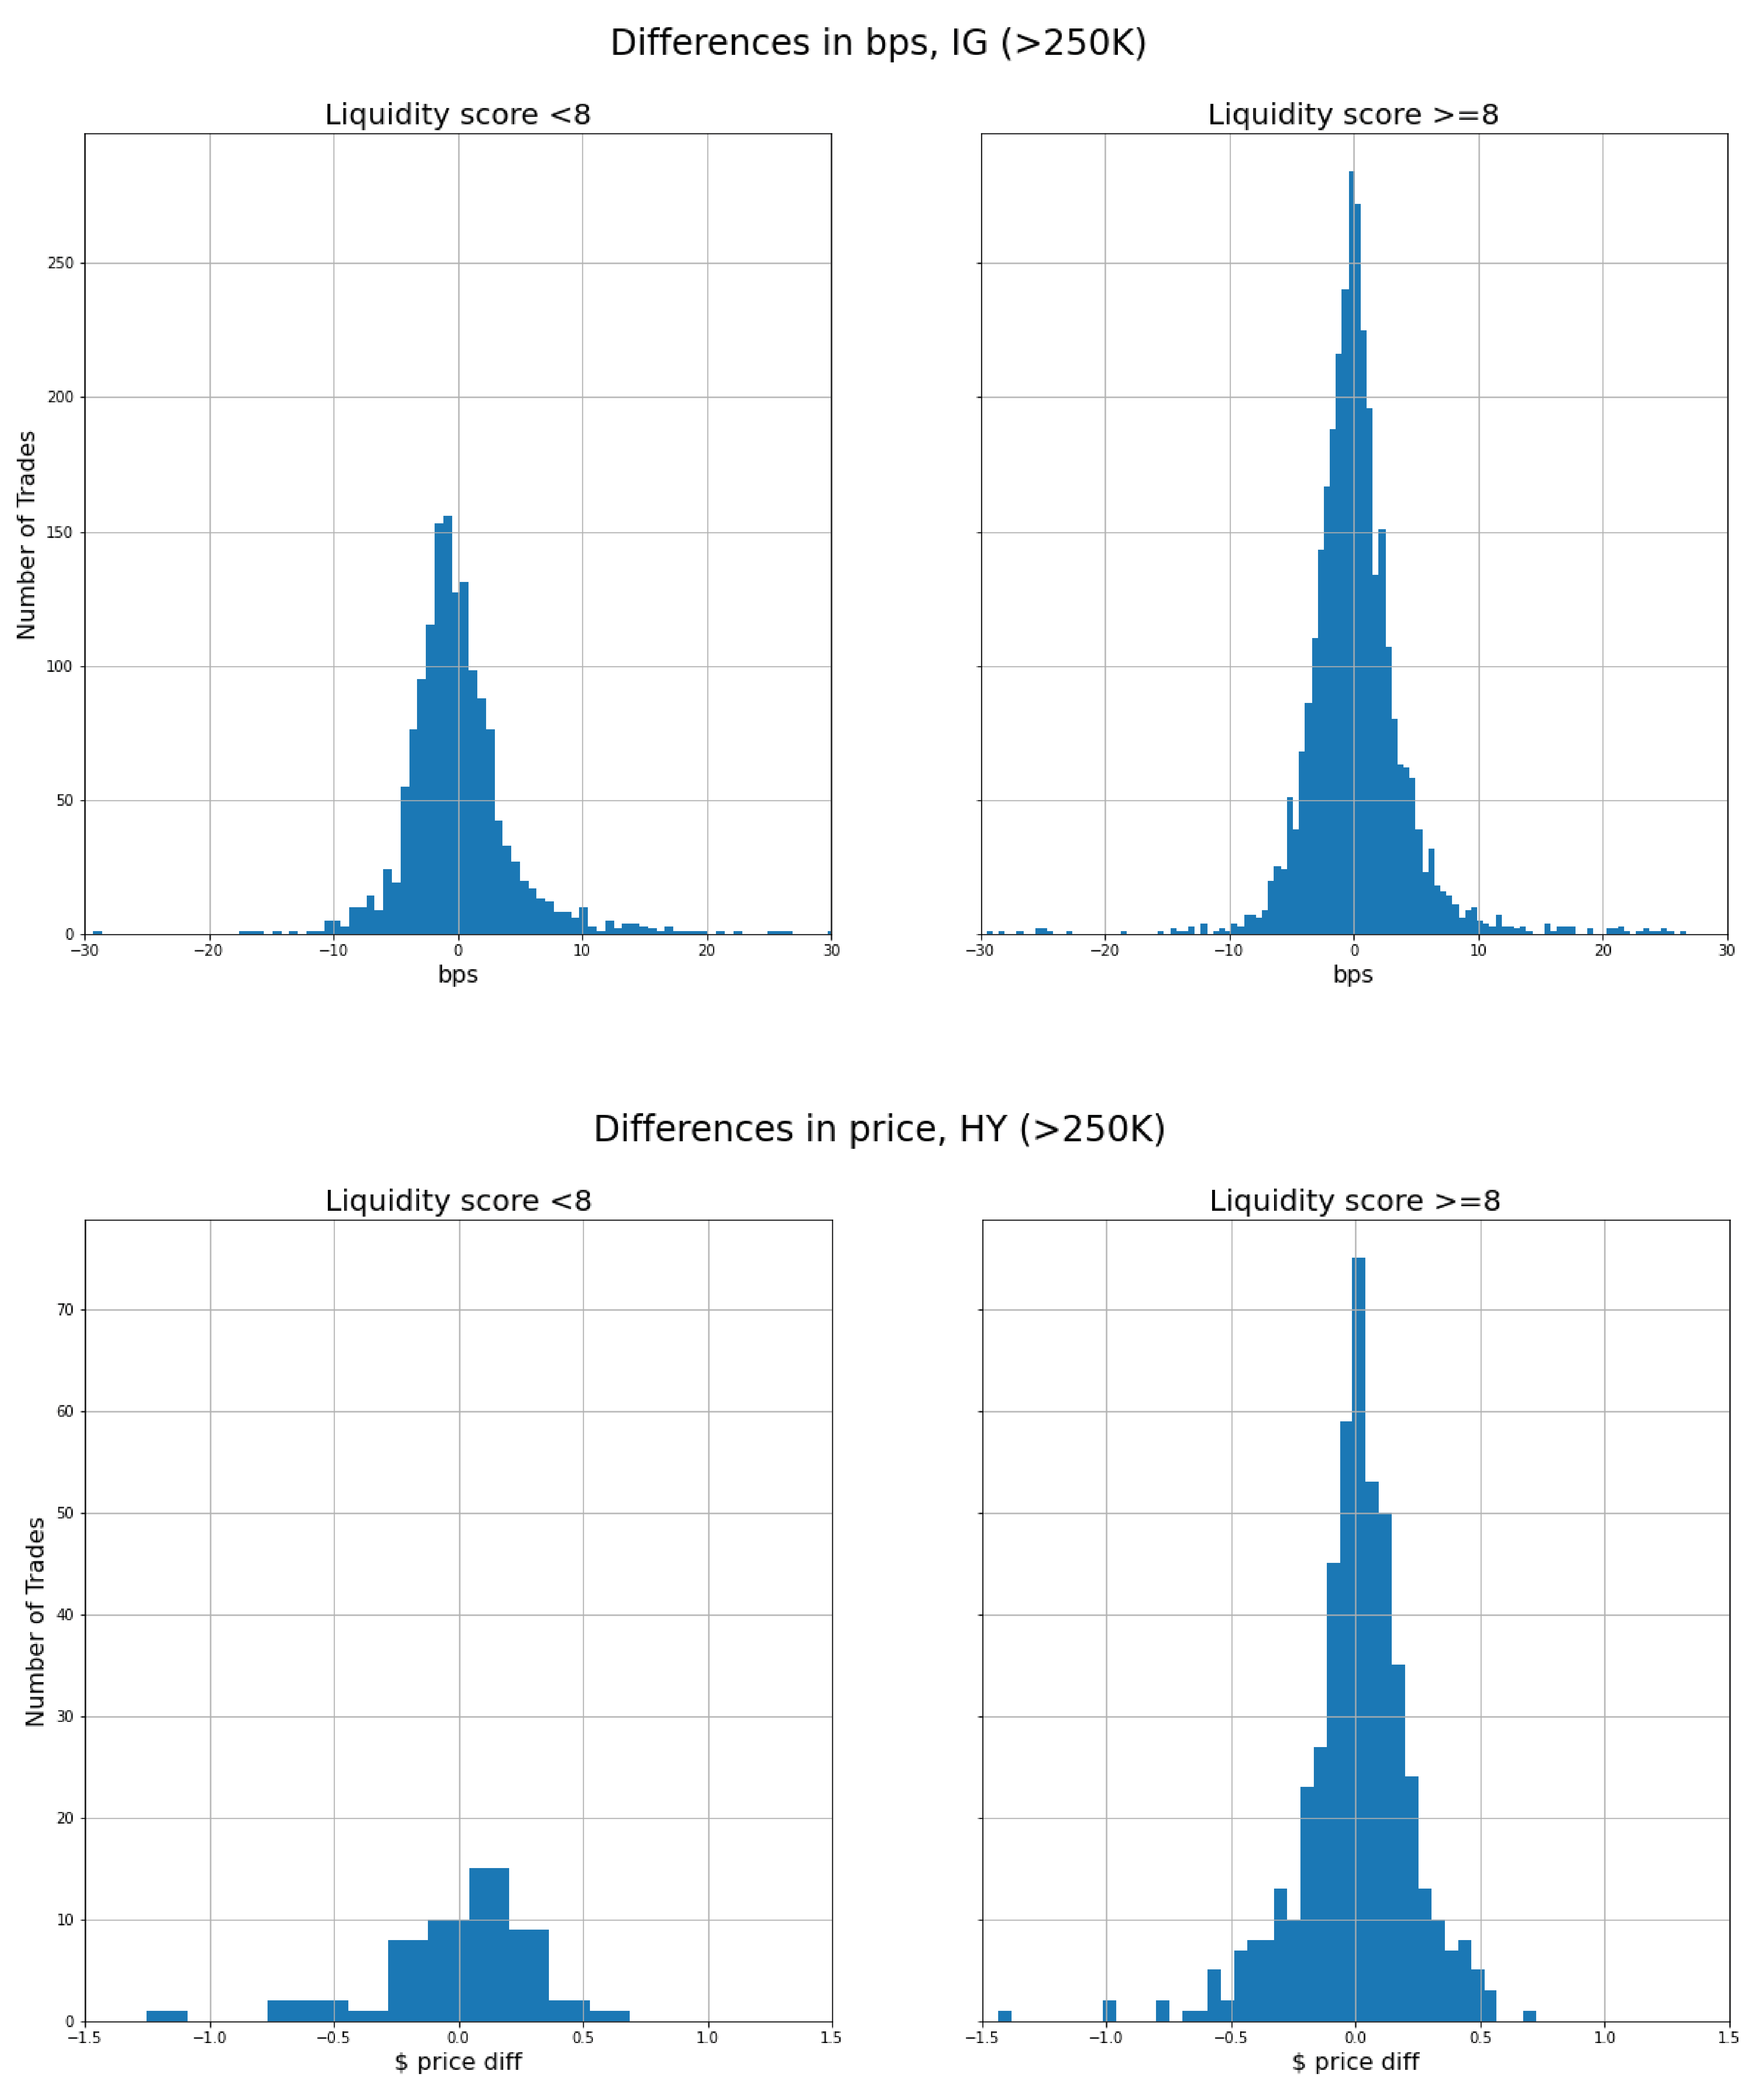
- Differences in price/spread to CEP for larger trades shows that ICE Data Pricing & Reference Data's valuations are close to where these trades clear
Introduction
The electronification of fixed income markets has led to a few salient patterns:
- Median trade ticket sizes have been trending smaller
- Investors have looked for systematic ways to offload risk on multiple securities simultaneously
The second point above led the Fixed Income Market Structure Advisory Committee (FIMSAC) to recommend that the Financial Industry Regulatory Authority (FINRA) amend its Trade Reporting and Compliance Engine (TRACE) disclosure rules so market participants could identify portfolio trades1. FINRA published a technical notice implementing this recommendation last year and the flag went live on Monday, May 15, 2023.
Statistics
We have now observed one week of portfolio trades (PT) as disseminated via TRACE2 for the week of 5/15/202 - 5/19/2023. Figure 1 and Figure 2 below show the counts and notional volume transacted (in millions "MM") for trades of size greater than 50K, split by whether the bond was an Investment Grade (IG) or High Yield (HY) bond. We have also stratified the counts by the disclosed side for the trade. Please note that the transaction size is capped in the data reported by TRACE.
| DealerBuy | DealerSell | InterDealer | All | |
|---|---|---|---|---|
| HY_IG | ||||
| HY | 406 | 835 | 257 | 1498 |
| IG | 4435 | 2399 | 2516 | 9350 |
| All | 4841 | 3234 | 2773 | 10848 |
Figure 1: PT Counts by trade side and asset class
| DealerBuy | DealerSell | InterDealer | All | |
|---|---|---|---|---|
| HY_IG | ||||
| HY | 250.85 | 288.43 | 93.34 | 632.61 |
| IG | 3218.16 | 1693.36 | 1717.77 | 6629.29 |
| All | 3469.01 | 1981.79 | 1811.11 | 7261.90 |
Figure 2: Capped PT Notional Volume in MM by tradeside and asset class
As Figure 2 shows, the total transacted notional volume via PT is around. $7.3 MM which is about 5.2% of the total reported (capped) notional volume on TRACE. Around 4.7% of the total reported (capped) notional is for investment grade bonds and the rest is high yielding corporate bonds.
Figure 3 stratifies the data in Figure 1 by the size of the trade to provide some additional information.
Figure 3: PT count by size bucket, trade side and asset class
We will track PT trading behavior on bonds with ICE liquidity score less than 8 and look to characterize it in a future article. Figure 4 describes the difference between our Continuous Evaluated Price (CEP)TM against the reported portfolio trade level stratified by liquidity score and asset class. Note that most of these trades are on relatively liquid bonds (liquidity score >= 8) and that the spread of these trades appears consistent across the liquid and illiquid bonds.

Figure 4: PT count by liquidity score and asset class
Additional Analysis
We analyzed all portfolio trades greater than $50K for dates 5/15/2023 - 5/19/2023. These include HY and IG and can also be broken up by side of the trade: Dealer Buy, Dealer Sell and Inter Dealer.
The first takeaway from the analysis of Portfolio Trades for days 5/15/2023 - 5/19/2023 is that they seem to occur mostly during three time periods: 15:00-15:05, 16:00-16:05 and 16:30-16:35:
The top chart in Figure 5 shows that there are three large spikes of Portfolio Trades corresponding to the time periods mentioned in the previous paragraph. We also see those three spikes in the full universe of trades since 3/1/2023, and we can assume that some of those trades are also Portfolio Trades. We call these “Estimated Portfolio Trades”.
Another interesting thing to note about the Portfolio Trades chart above is the spike from 10:30 to 10:35. Those ~3000 trades took place on Friday 5/19 and represent 74% of the activity seen during that day. However, that time of the day doesn’t correlate with big market activity for overall trades going back to 3/1/2023.
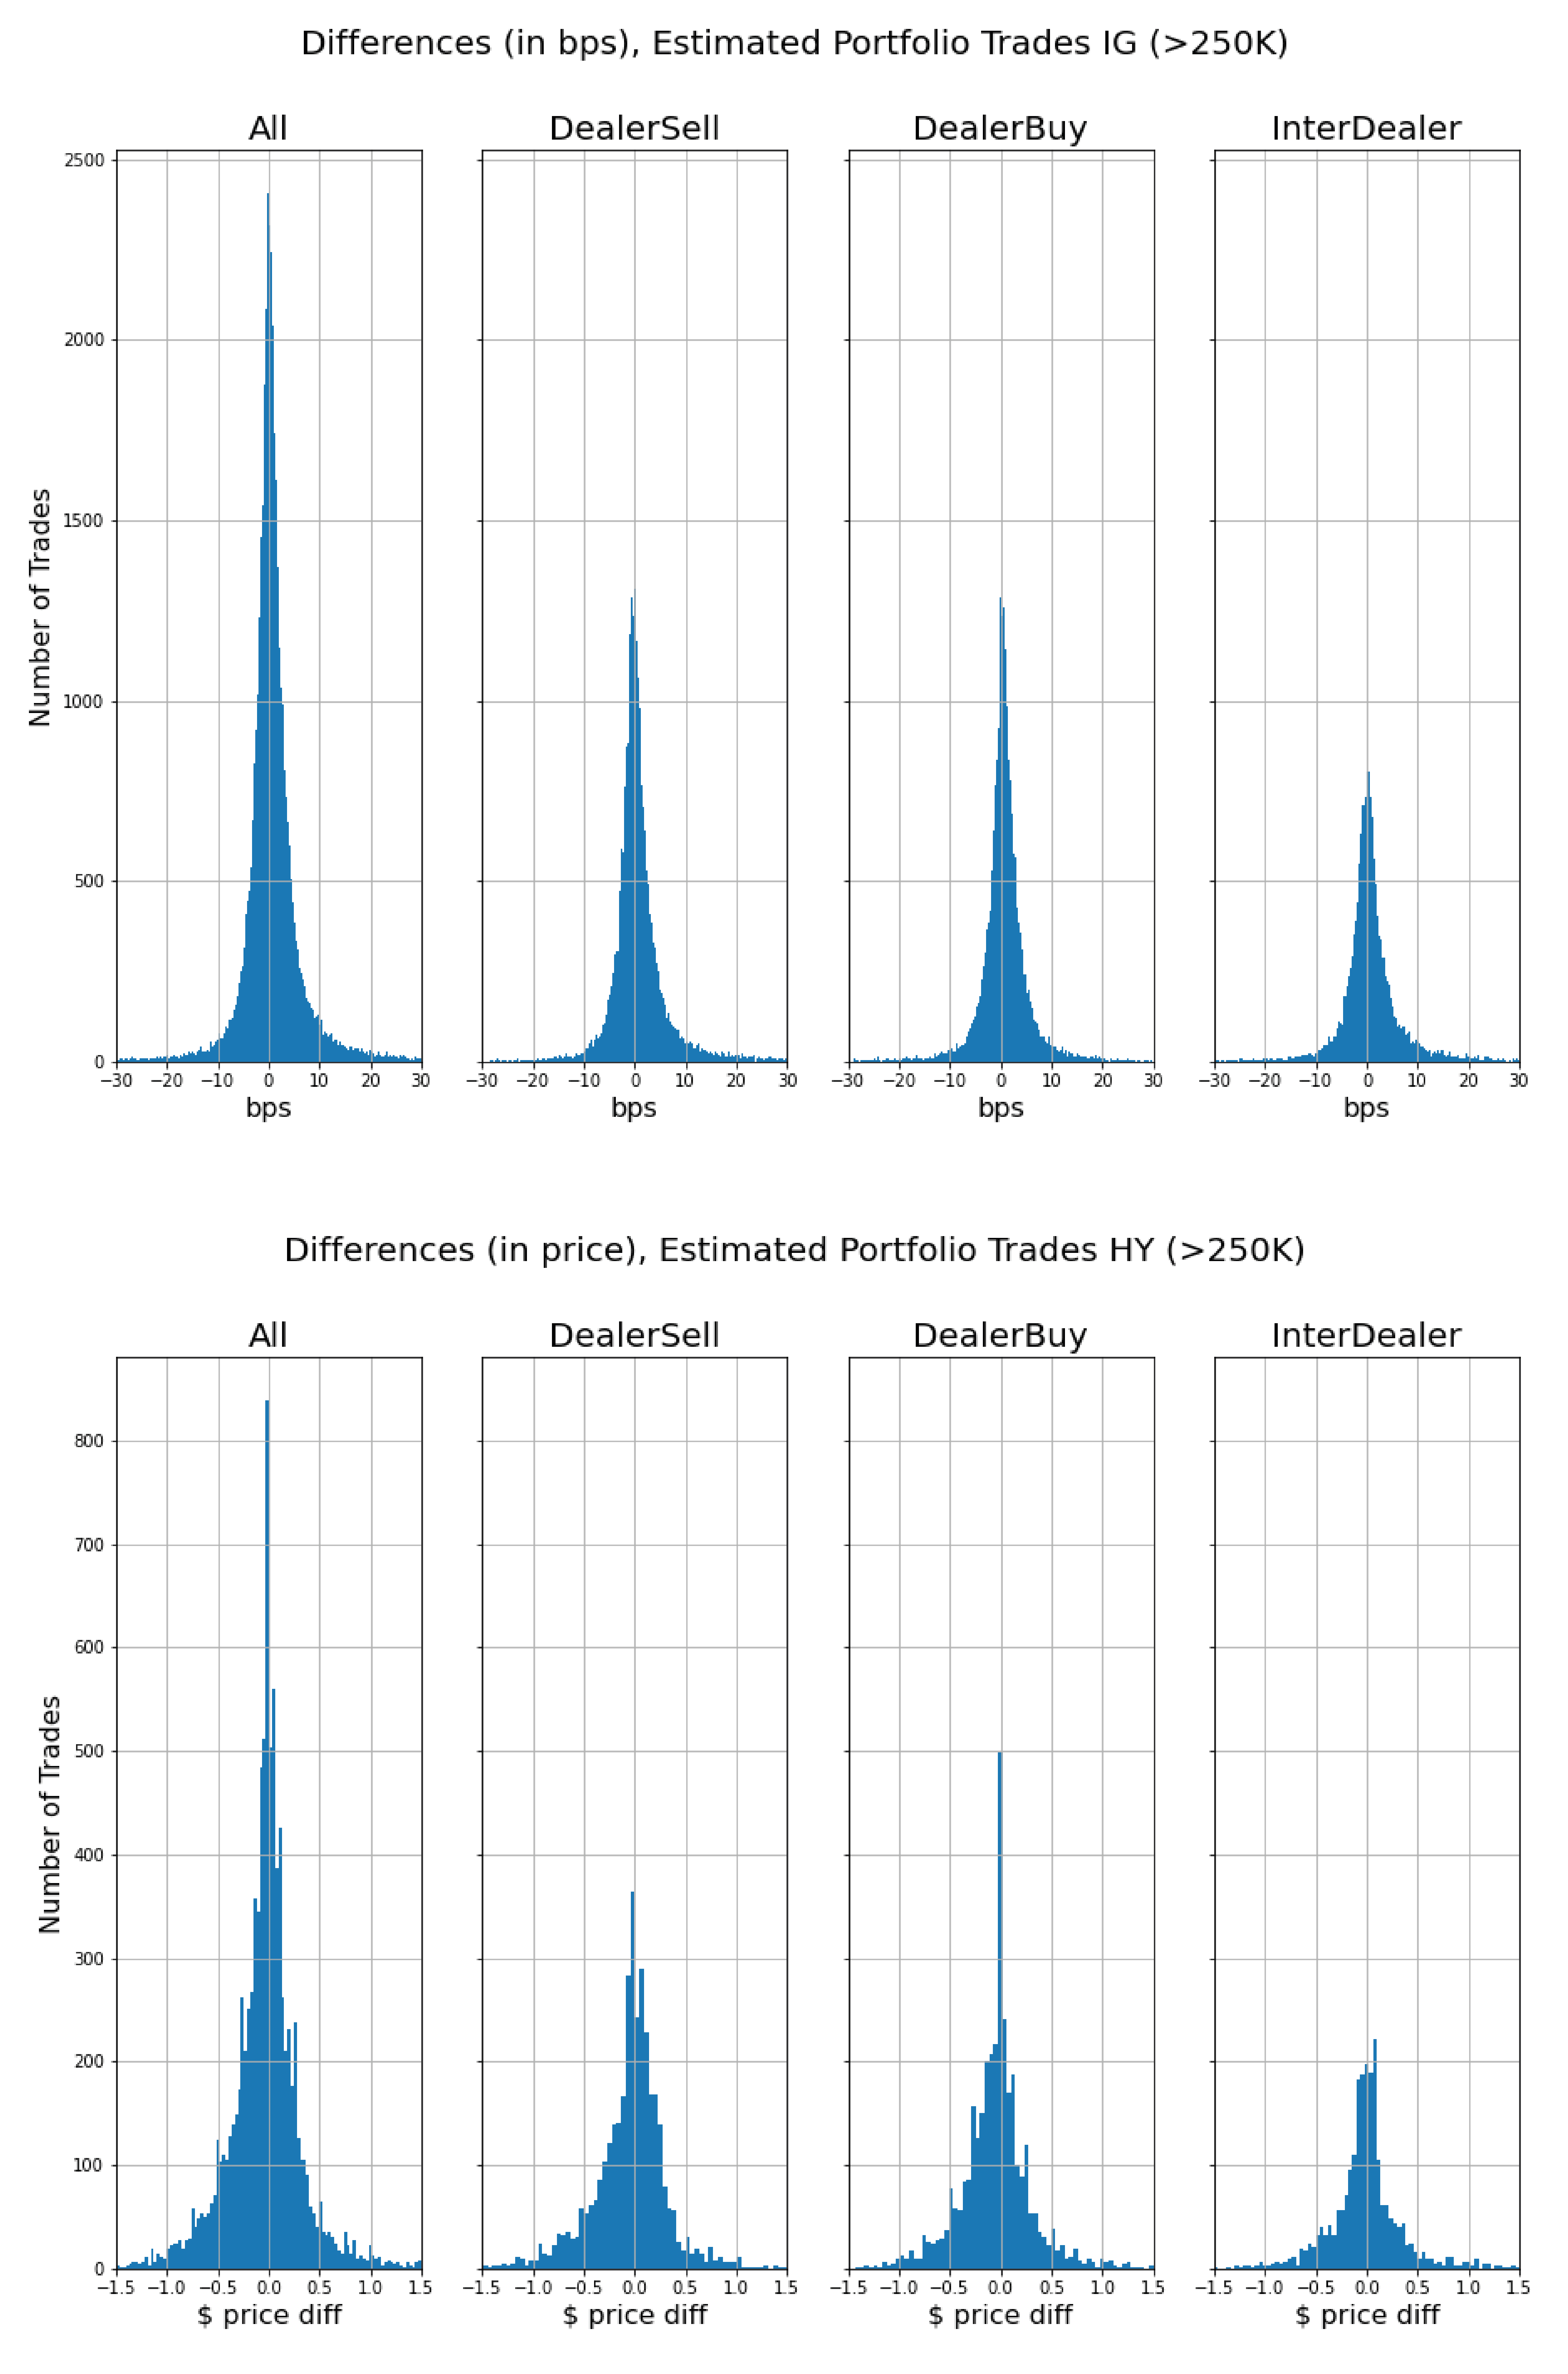
We can also calculate the difference between execution price and CEP for the Estimated Portfolio Trades:

It is particularly interesting that for HY trades, the difference lies overwhelmingly at 0, which suggests that our published CEP prices are reflective of the reported price.
Conclusion
Our preliminary analysis identifies a pattern on the time of the day where Portfolio Trades are most likely to be disclosed. We are pursuing a few other avenues of research to identify the most impactful of these Portfolio Trades.
- Full recommendation available here.
- The analysis provided below is based on PTs that was reported via TRACE between May 15, 2023 and May 19, 2023.